Orange Widgets
Orange widgets are building blocks of data analysis workflows that are assembled in Orange’s visual programming environment.
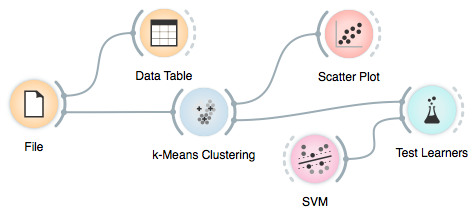
Widgets are grouped into classes according to their function. A typical workflow may mix widgets for data input and filtering, visualization, and predictive data mining.
Data
Visualize
Classify
Regression
Associate
Unsupervised
 Distance Matrix Filter Distance Matrix Filter |
||
 Interaction Graph Interaction Graph |
||
Index:
- File
- Paint Data
- Data Table
- Select Attributes
- Rank
- Purge Domain
- Merge Data
- Concatenate
- Data Sampler
- Select Data
- Save
- Discretize
- Continuize
- Impute
- Outliers
- Edit Domain
- Python Script
- Distributions
- Scatter Plot
- Attribute Statistics
- Linear Projection
- Radviz
- Polyviz
- Parallel Coordinates
- Survey Plot
- Mosaic Display
- Sieve Diagram
- Naive Bayesian Learner
- SVM Learner
- Logistic Regression Learner
- Majority Learner
- Classification Tree Learner
- Classification Tree Graph
- Classification Tree Viewer
- CN2 Rule Learner
- Rule Viewer
- k-Nearest Neighbours Learner
- Nomogram
- Random Forest
- C4.5 Learner
- Interactive Tree Builder
- Mean Learner
- Linear Regression Learner
- Regression Tree Learner
- Regression Tree Viewer
- Pade
- Confusion Matrix
- ROC Analysis
- Lift Curve
- Calibration Plot
- Test Learners
- Predictions
- Association Rules
- Association Rules Filter
- Association Rules Tree Viewer
- Distance File
- Distance Map
- Example Distance
- Attribute Distance
- Hierarchical Clustering
- Interaction Graph
- K-Means Clustering
- MDS
- Principal Component Analysis